Examples - Telephone Calls
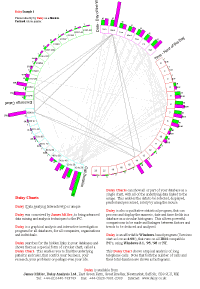
The Daisy Chart is a graphical representation of the telephone calls made by a series of fax machines used to deliver documents.
This Daisy analysis is very common and is one of the most powerful. A special additional program called Daisy TMS is available for the analysis of telephone calls and the production of bills and reports.
View a full description of this example, that will be shown after the chart has been drawn.
Open this Daisy Example by choosing 'TelephoneCalls' in the Examples command in the Open Database command or click the link below.
Note that clicking the link above will also set the chart size to portrait which is recommended for this example.